Bitcoin Pullback recovery Week: The week started with BTC moving rangebound and declining 3.0%, liquidation crossed $350 million, and broke the recent support levels at $102,000. At the weekend, the market recouped 2.0%. Investors fueled it with the inflow of capital into BTC-based ETFs. Also, the Fear & Greed Index was at 54, assuring market stability.
Key Highlights:
- Market Movement: Bitcoin started the week in a range-bound market, experiencing a 3% drop and breaking through the $102,000 support level, reaching a low of $100,400.
- Rising Liquidations: $350 million worth of liquidations were recorded, highlighting the volatility in the market and the impact on over-leveraged positions.
- Swift Recovery: Bitcoin quickly recouped 2.0% the following day, fueled by institutional buying and ETF inflows, showing resilience despite the initial decline.
- Institutional Support: Strategy Inc. and Metaplanet announced significant Bitcoin acquisitions, driving investor confidence and supporting the market’s recovery.
- Neutral Sentiment: The Fear & Greed Index remained at 52, indicating a neutral market sentiment, as investor fears were alleviated by institutional moves and macroeconomic factors.
- Technical Patterns: A hammer candlestick pattern on the weekly chart suggests indecision, with a potential bullish reversal if Bitcoin crosses the critical level of $106,800.
Recently, Bitcoin has been in the global news for various reasons, such as investors injecting cash flow into BTC ETFs, the US Senate discussing it as an alternative digital currency, Bitcoin moving to an all-time high, and becoming a popular digital asset for financial institutions. Bitcoin’s price movement is frequently analyzed, as it is a significant indicator of overall market sentiment, investor behavior, and the strength of the cryptocurrency ecosystem.
In this article, we will highlight the turning points and analyze the Bitcoin (BTC) Chart to provide recent developments in Bitcoin during the first week of June 2025.
Bitcoin Pullback: A Perfect Storm of Market Forces
Following the previous week, Bitcoin (BTC) has witnessed a significant drop of 3% and landed at $100,400. The next day, BTC surged by 2.0%, making a strong comeback and trapping the sellers. Even though BTC has breached its support level of $102,000, it has taken very reliable support on the MA Crossover, which we can easily see on the Daily Chart. The BTC market pullback theory was supported by macro factors and heavy liquidations by whales. On June 6th, 2025, BTC liquidation was around $340 million. Ethereum and other cryptos joined the party following them, and liquidation data hit $980 million. Later, that resulted in sinking the market.
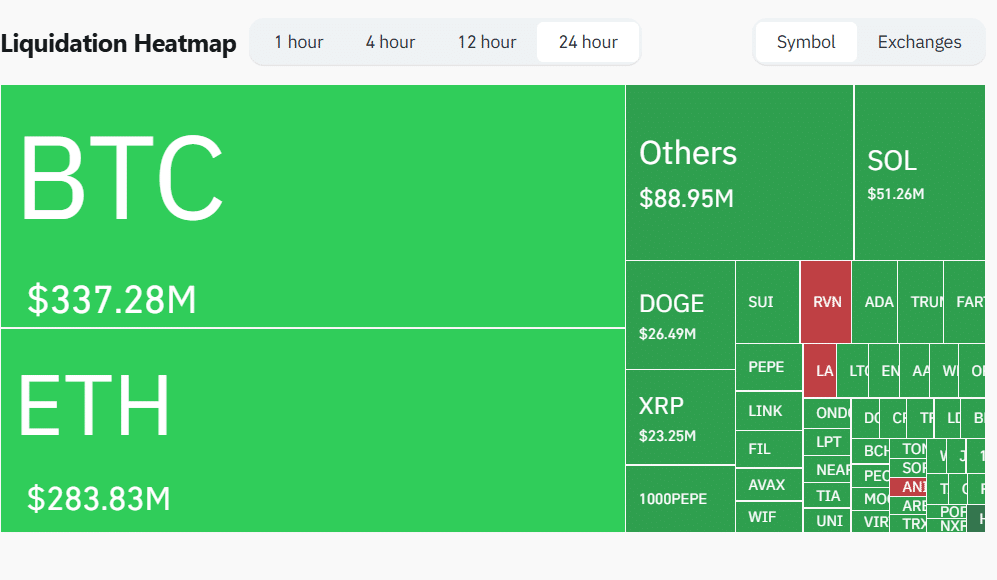
Source: Coinglass
The sudden volatility crushed many traders whose positions were overleveraged and had to pay a hefty price. The whale offloading news had built up enough pressure that brought bearish market sentiment. Among the uncertainties, news of Elon Musk’s and President Trump’s clashing statements over government spending has fueled the market downfall. Eventually, large crypto movements were observed from wallet to exchange, indicating a bearish signal or Bitcoin pullback.
Bitcoin Pullback Recovery: Institutional Moves and Macro Factors at Play
As the liquidation showed its effect as bearish sentiment, the BTC fell to $100,372.26. The very next day, the market took a turn, and BTC surged 2.0%. The market has started recovering from the downfall, which was later backed by institutional buying, ETF inflows, and market demand for Bitcoin as a hedge against economic uncertainty.
Institutions like Strategy Inc., previously known as MicroStrategy, revealed plans to acquire more Bitcoin-worth stocks valued at $979.7 million. In addition, Metaplanet, a Japan-based investment firm, disclosed its revised target for Bitcoin from 21K BTC to 100K BTC—this increased investors’ confidence, which resulted in the market surging. Therefore, the Bitcoin pullback recovery was swift.
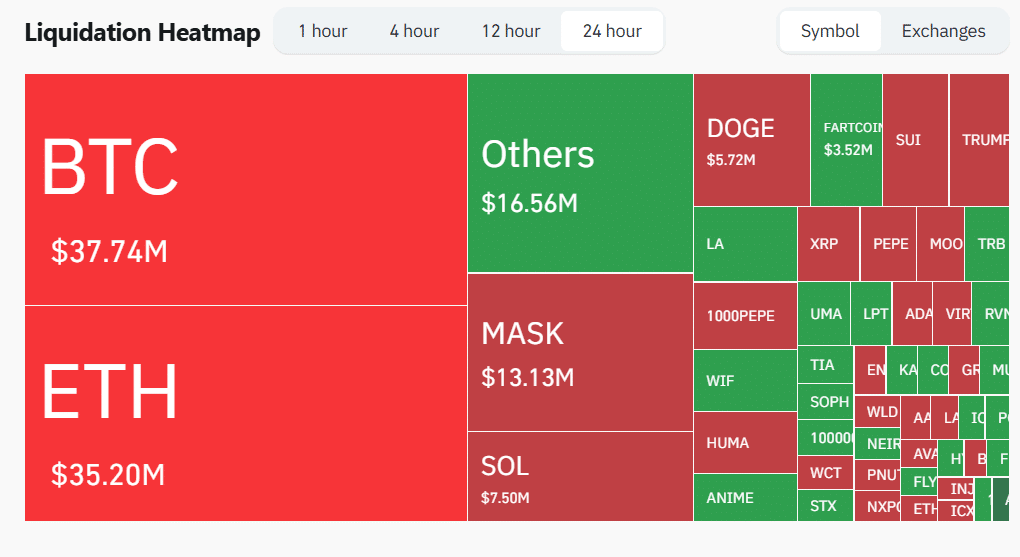
Source: Coinglass
This liquidation heatmap can easily be evident as long-term liquidations have stalled, and inflows have initiated upward movement. Now, Bitcoin has moved from the correction to the recovery and is trading above the $105,000 levels.
The BTC market has revived, and fear has lost its ground, according to The Fear and Greed Index meter, currently showing 52, which means neutral sentiments. However, institutional demands and macroeconomic circumstances can act as catalysts anytime, refuelling the market to new heights.
Bitcoin Price Movement and Market Sentiment:
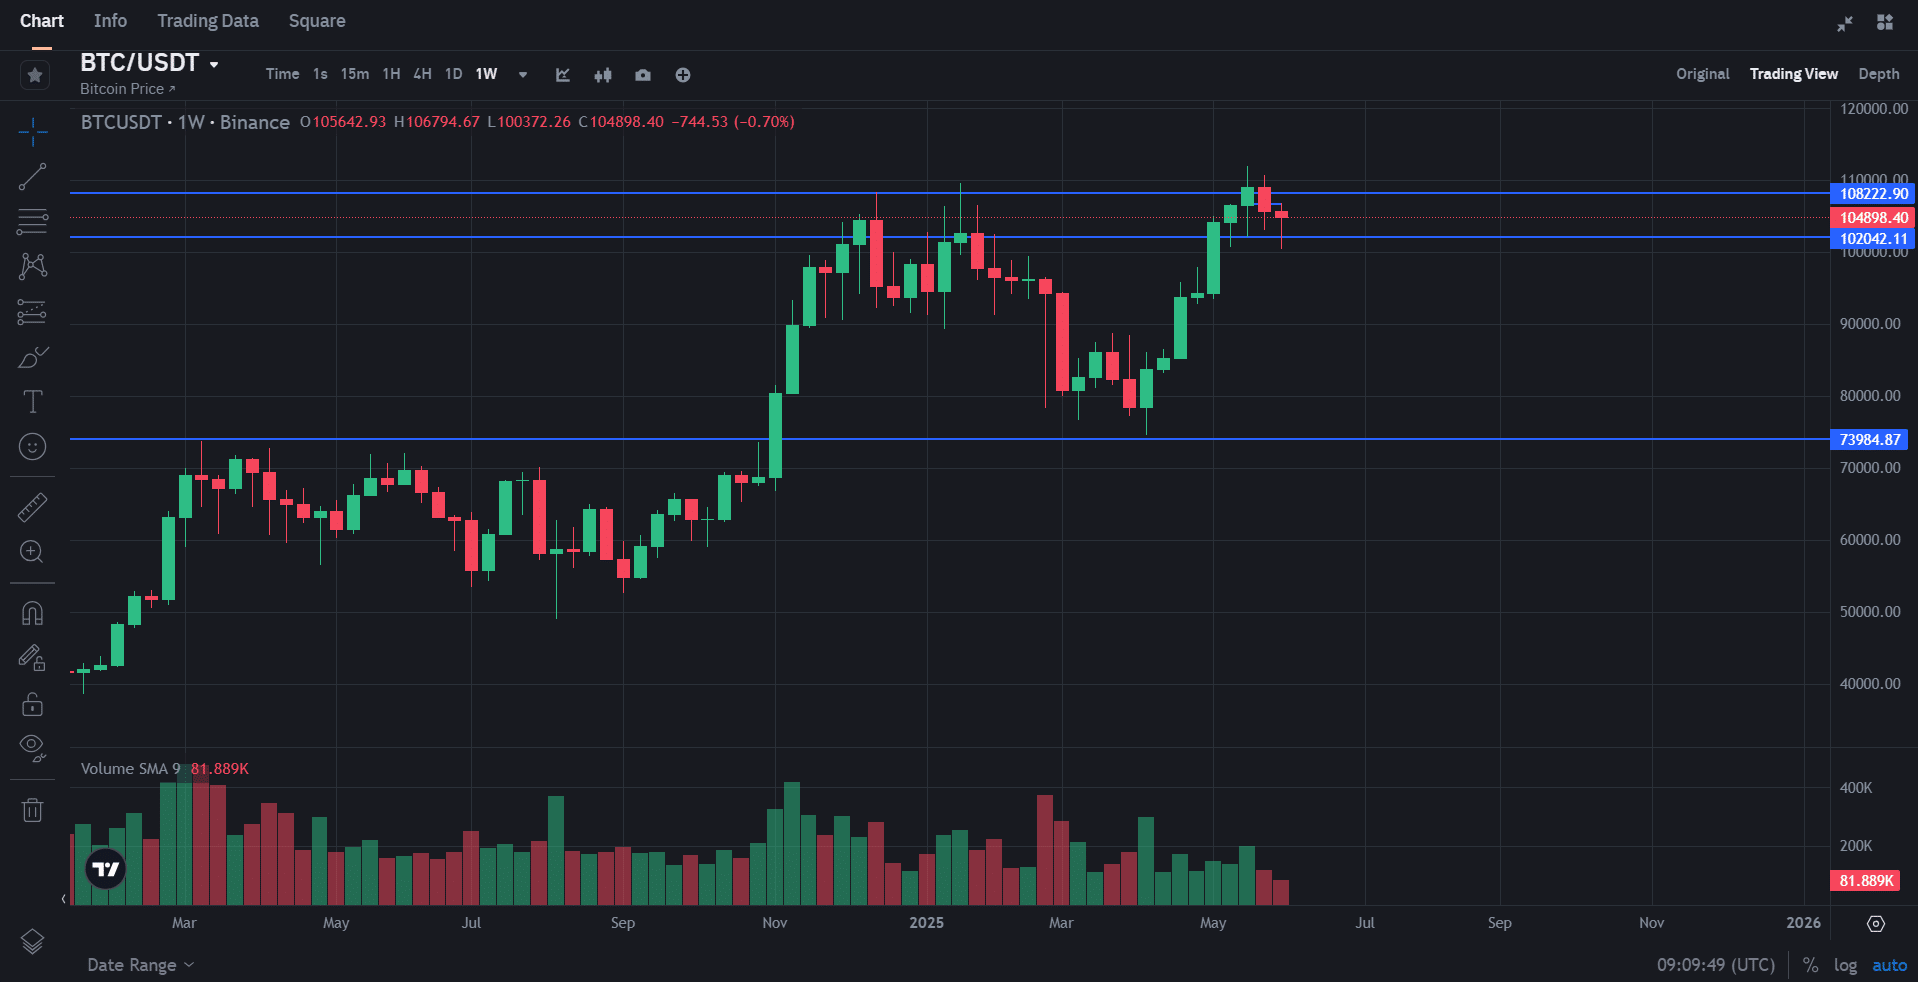
Source: Binance
The Weekly Chart for BTC reveals the price crossing the support level of $102k, going down to 3.0%, and then retracing swiftly to the $105k level, gaining 2.0%. Since the start of this week, the BTC market has been trading sideways and plunging, but has also recovered swiftly and joined the upward journey by the weekend. This week has witnessed volatility, which we can confirm from the Hammer pattern. It reflects that the price went down to lower levels and then recovered, leaving the sellers trapped.
The leading cryptocurrency, Bitcoin, maintains a bullish sentiment and will be heading to new highs, as this recent rejection from the support level has indicated its strength and momentum.
Similarly, if a bear overshadows the journey, BTC can stall or take support at $102,000 levels. Furthermore, if liquidation pressure increases, it could plunge below $100,000.
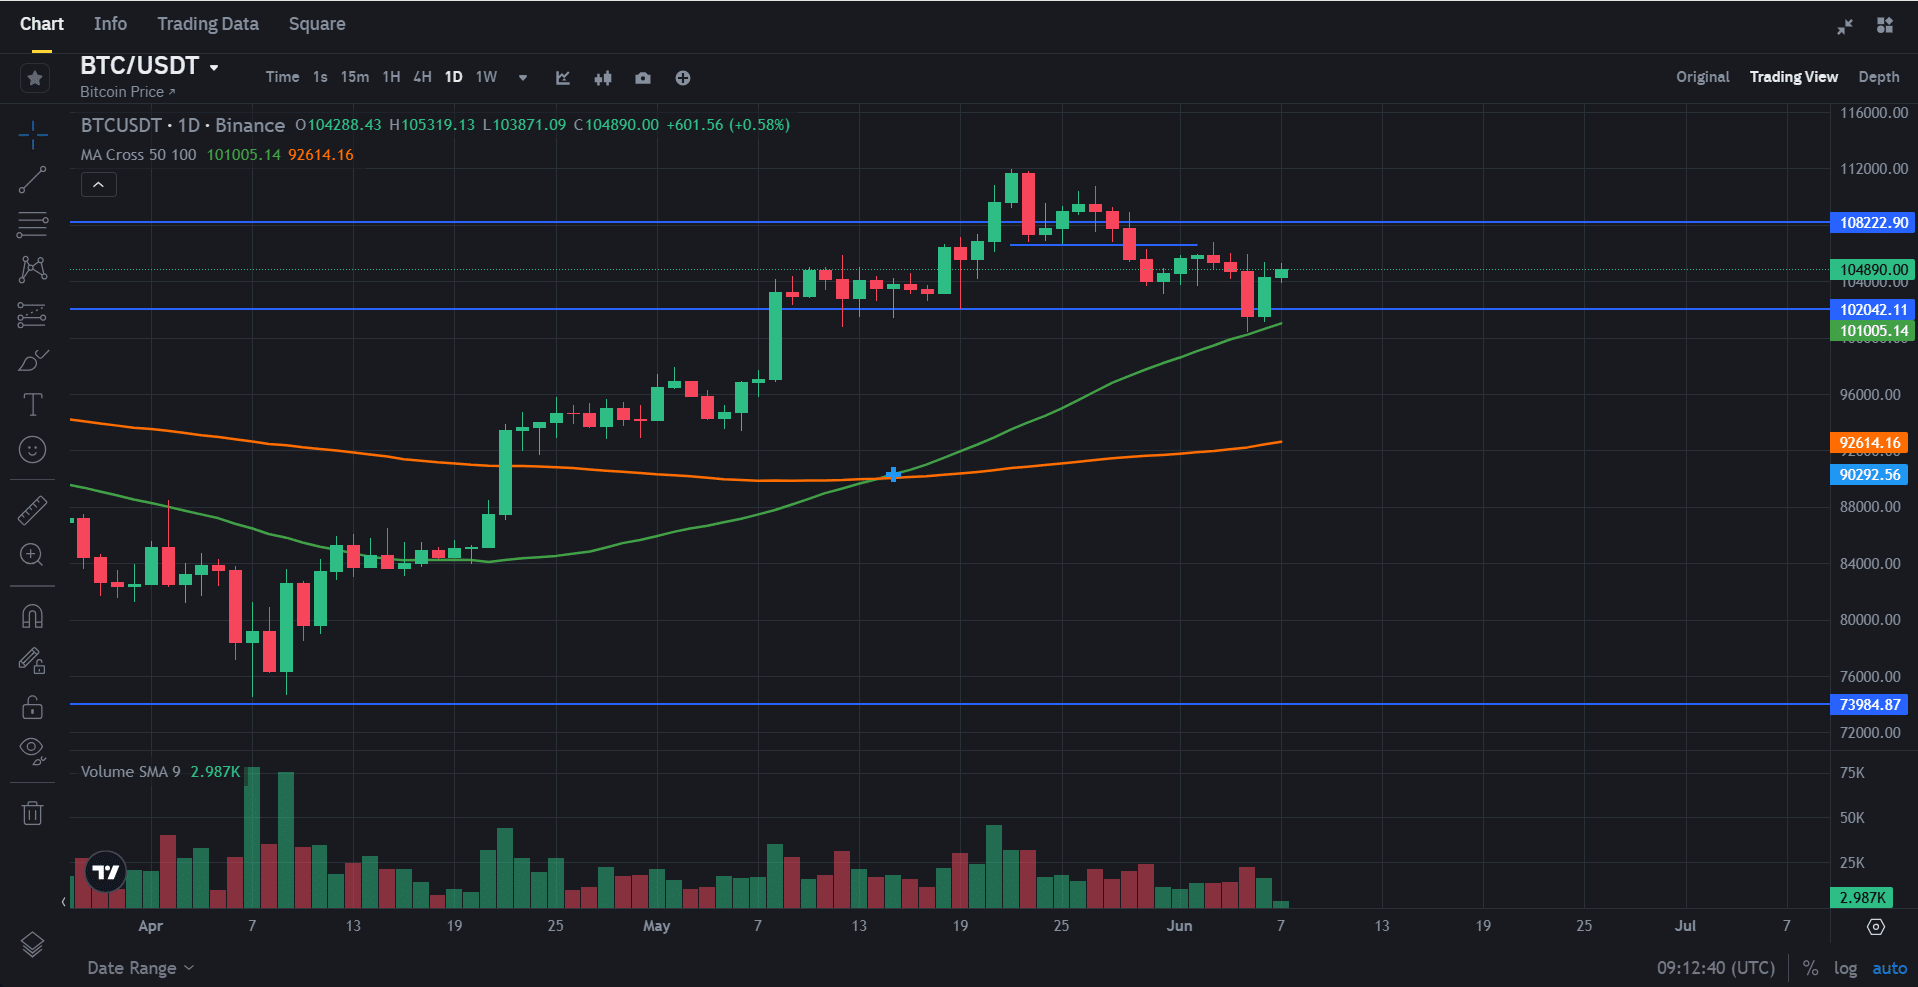
Source: Binance
Reviewing the BTC daily Chart shows the perfect example of reliable support from the MA crossover or SMA 50. If BTC’s upward movement continues and crosses the $106,800 level, the possibility would be more of heading towards a higher high. On the contrary, if it fails to cross the level and plunges, we can certainly witness the formation of a pattern of lower highs and lower lows, which can result in a downtrend. But let’s not discuss that until the liquidation issue intensifies. Also, BTC is trading above $105,000 and has momentum; any ETF’s inflows or macroeconomic information can quickly influence the price. Investors looking for long-term positions in BTC should consider crossing the previous high levels of $106,800.
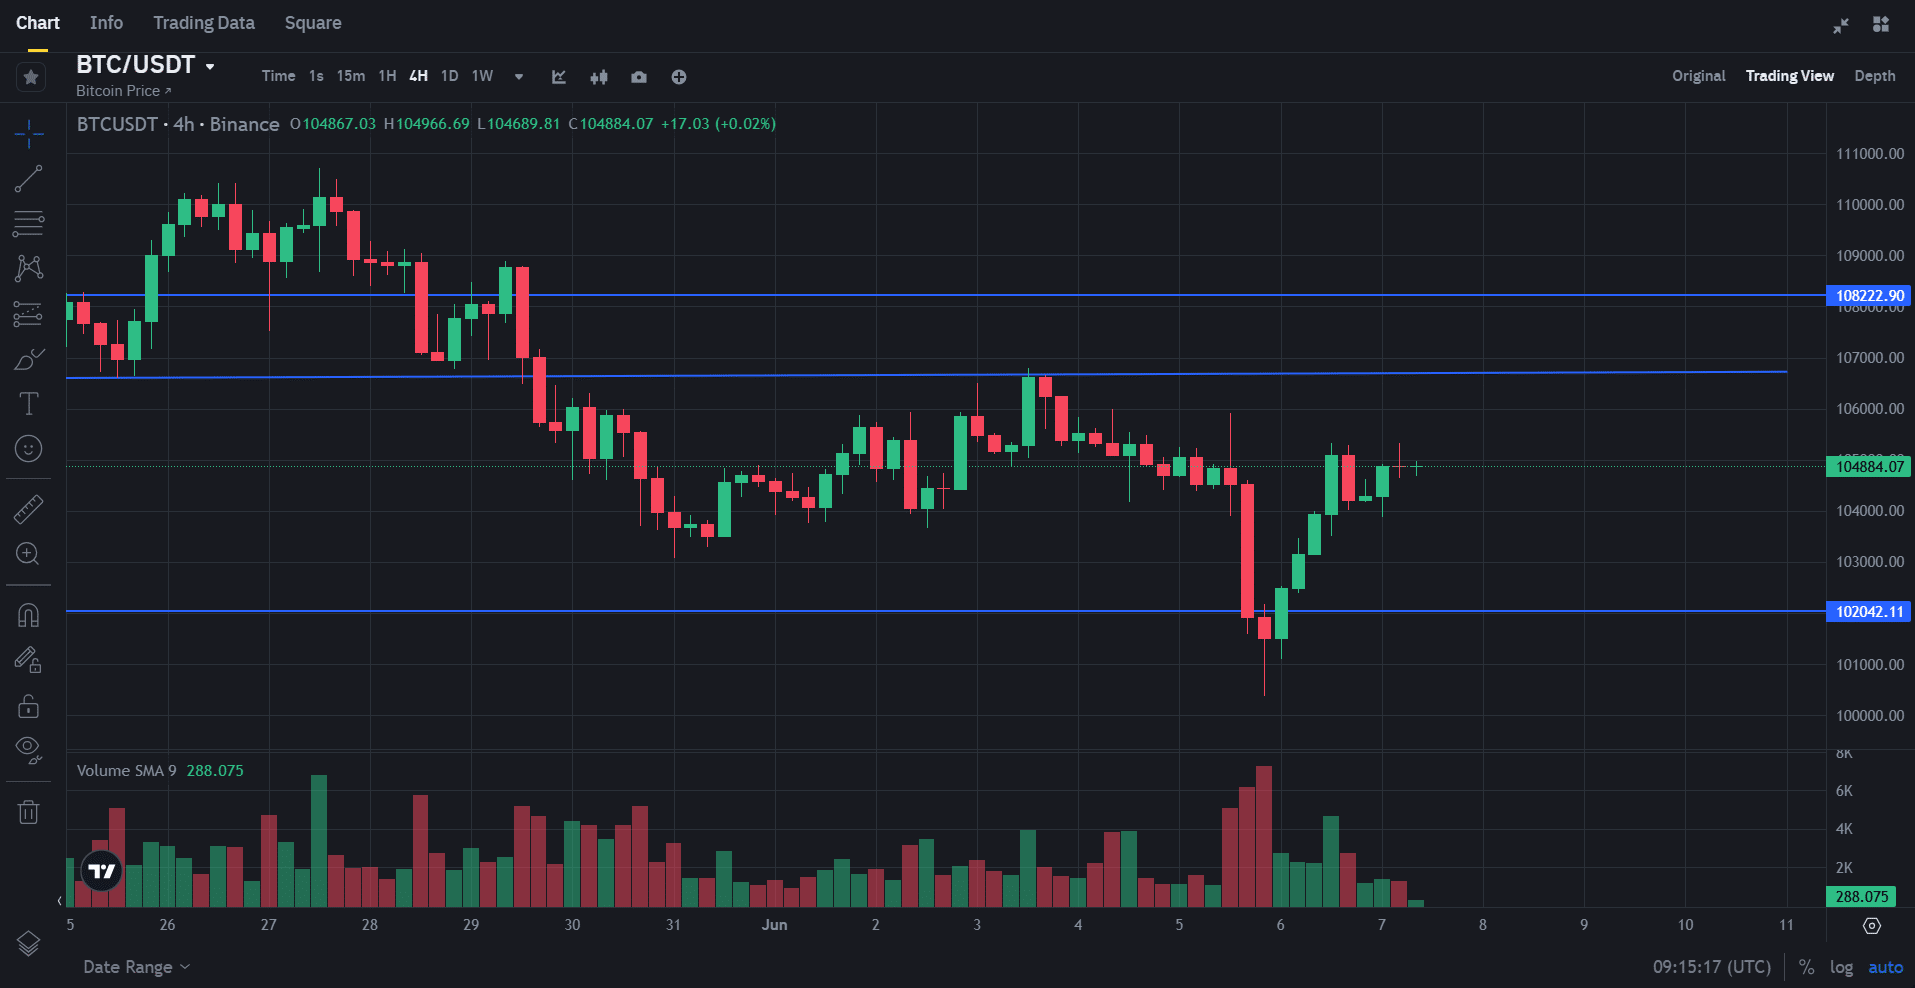
Source: Binance
On the 4-hour chart, BTC has rebounded from a local bottom of $100,500 and is now stabilizing around the $104,500 to $106,500 range. We can experience the red hammer candlestick pattern forming after breaking the support range, but this itself does not prove the point of reversal. As we know, the formation of a hammer candlestick in the downward movement signifies a reversal. But if volume rises, as it is rising in this case. The higher the volume, the new players or investors are added to the trade. If we see the chart, the biggest volume bar has a hammer pattern, and combining these two ensures a strong reversal. Also, it is evident from that point that the BTC rises and moves upward with momentum, and making higher highs indicates more strength. The $106,800 mark is crucial for BTC to cross to continue the upward journey.
Conclusion:
This week was full of “the Bitcoin Pullback Recovery” story, like in movies, starting with the Bitcoin pullback and continuing with a solid climax or recovery from the pullback over the weekend. Bitcoin pullback reasons and recovery reasons were all thoroughly backed up by technical analysis. The vital and significant point for Bitcoin to continue its upward journey is the $106,800 resistance to break. The coming week, macroeconomics, liquidation data, and all other aspects will remain responsible for any development in the Bitcoin market.
Also Read: